For years, the National
Election Studies (NES) have used something called "Feeling
Thermometers" to guage attitudes toward persons and groups.
Here's the actual lead-in to the item from the interview
schedule: Based on the responses, the NES constructs scales from 0
to 100. These scales tend to demonstrate considerable
variation in respondents attitudes toward the persons or
groups in question. The vote00.por file contains such
scales for 35 different persons and groups. Here are some
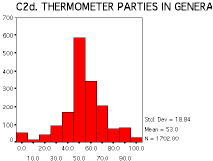
illustrative graphs from those items. The Republican presidental
candidate, George W. Bush drew scores across the temperature
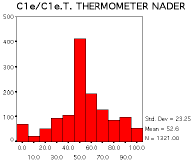
scale, but mostely toward the middle. Green Party candidate, Ralph
Nader, was even more likely to get "middling" responses,
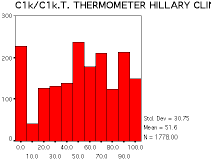
revealing less variation in feelings. On the other hand, Hillary
Clinton proved to be a much more controversial figure, with
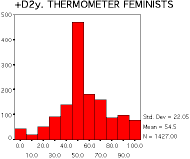
scores at both ends rivaling the middle. Feminists as a group were
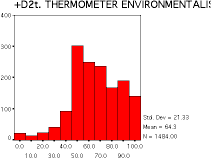
not well defined, but mainly were positive. Environmentalists, on the
whole were more favorably viewed than Feminists. Political parties in general
tended to be viewed more positively than
negatively.
I'd like to get
your feelings toward some of our political leaders and
other people who are in the news these days. I'll read
the name of a person and I'd like you to rate that
person using something we call the feeling thermometer.

Be sure to include such a graph at the beginning of your
paper to establish the task for explanation.