|
Variables in the equation
|
|
(constant)-3.32 + .756Party
Identification
|
|
|
Predicted Vote in 1992
|
% Correctly Predicted
|
|
Observed vote in 1992
|
Clinton
|
Bush
|
|
|
Clinton
|
40
|
8
|
82.8
|
|
Bush
|
8
|
30
|
78.9
|
|
Overall percentage correctly
classified
|
81.1
|
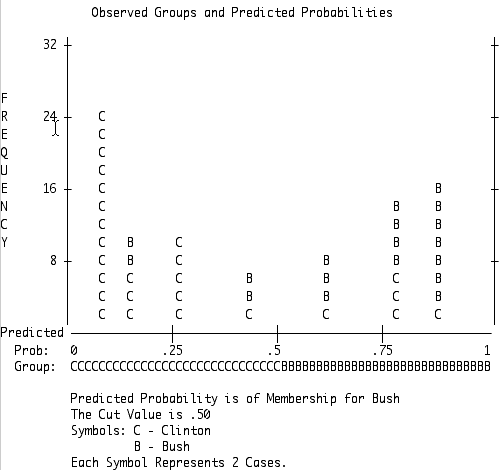
Binary Logistic regression produces a
plot:
|
|
Canonical Discriminant Function
Coefficients, Function 1
|
|
(constant) -2.154 + .562Party
Identification
|
|
Unstandardized coefficients
|
|
Predicted Group Membership
Count of Cases
|
|
Vote in 1992
|
Clinton
|
Bush
|
Total
|
|
Clinton
|
40
|
8
|
49
|
|
Bush
|
8
|
30
|
38
|
|
Predicted Group Membership
Percentage of Cases
|
|
Clinton
|
82.8
|
17.2
|
100
|
|
Bush
|
21.1
|
78.9
|
100
|
|
81.1% of original grouped cases
correctly classified.
|
|
Ungrouped cases
|
32
|
21
|
53
|
Note the treatment of those who didn't vote for
either.
|