|
Earlier versions of SPSS
contained a simple PLOT procedure that also produced
regression statistics. SPSS 10 has dropped that simple
procedure, but one can get a plot with regression
statistics. As described by Ms. Wuyi Wang at SPSS, Inc.,
this is the procedure, with illustrations from
me:
- Go to
Graphs->Interactive->Scatterplot

- drag and drop
the variables to the vertical axis and horizontal
axis.

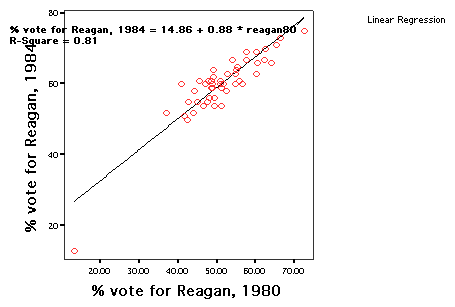
- It should look like
this:

- Right-click on each
variable to make sure that Scale is
selected
- [SPSS
interprets data without decimals as
"Ordinal"]
- (if the variable is
tagged as Ordinal no regression line will be shown).
- Click on the Fit
tab. Select Regression from the drop-down list
(the default is None).

- Leave all other
settings as default.
Click OK. A
scatterplot made this way has the regression line and
R-squared.
Assumptions about the distributions of variables involved
in correlational analysis
-
- For maximum utility in analysis, correlation and
regression assumes that both variables have unimodal,
symmetrical distributions -- at least that one or the
other variable is not highly skewed in either
direction
-
- In a technical sense -- and using a term to be
defined explicitly later -- both variables are assumed to
approximate a normal distribution, which looks
like this:
-
 - Problems arise if either variable departs from a
normal distribution
- If one variable is skewed away from a normal
distribution, and the other is not, the correlation can
never equal 1.
- If both variables are skewed away from normal, the
relationship is likely to be artificially high.
How to convert skewed distributions to one that are more
"normal"
- Use the COMPUTE command in SPSS to transform
the variable by pulling in the outliers
- See the transformation
of a variable on "CIVIL DISORDER" computed for
nations across the world
|